Build a sales dashboard with the Graph
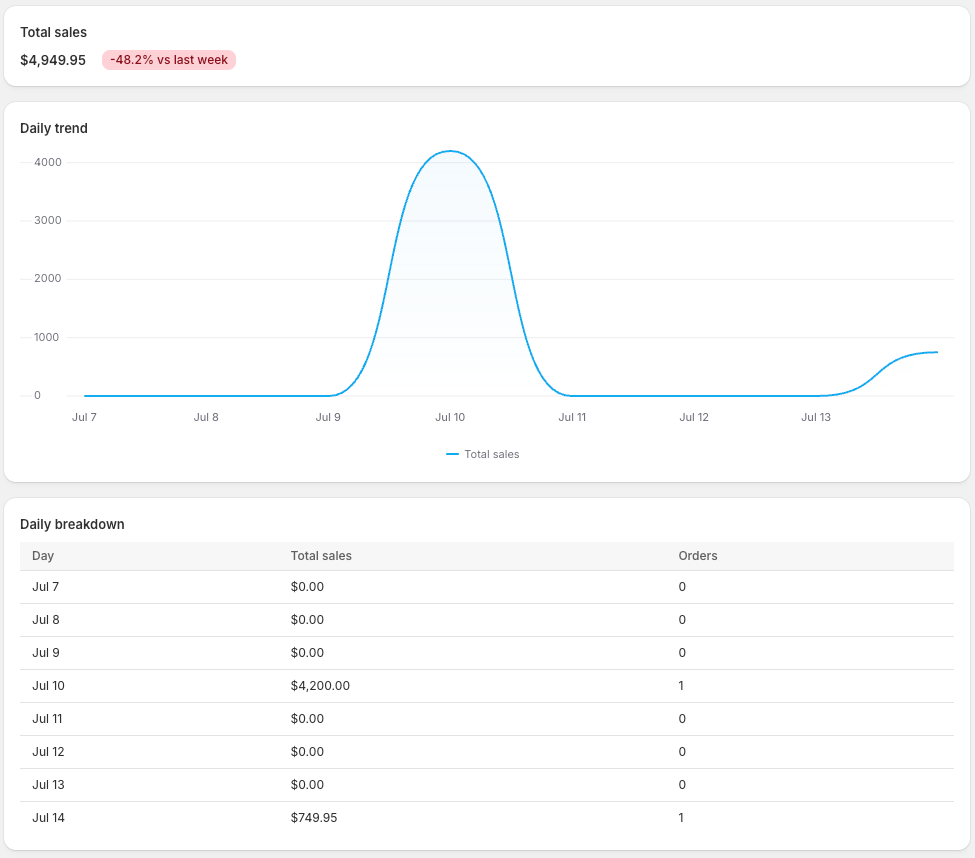
In this tutorial, you'll build an embedded app that reports a store's weekly sales. The app shows the total sales for the week with the change from last week, charts the daily trend, and ranks the top-selling products.
Anchor to What you'll learnWhat you'll learn
You'll learn how to do the following tasks:
- Write a ShopifyQL query for a store's daily sales this week and last.
- Read the total from the
tableDataresponse and compute the week-over-week change. - Rank the store's top products with a second query that uses
GROUP BY TOP.
Requirements
An embedded app built from the React Router template. An app built with Shopify CLI has authentication already configured, so your app can make authenticated GraphQL Admin API requests.
shopifyqlQuery requires Level 2 access to protected customer data. Approval can take time, so request it early.
shopifyqlQuery is available in the GraphQL Admin API as of version 2025-10.
Project

Anchor to Request the access scopeRequest the access scope
shopifyqlQuery requires the read_reports access scope. Request it in your app's configuration so that users grant it during installation.
Anchor to Add the access scopeAdd the access scope
In shopify.app.toml, set the scopes value to read_reports. When you run your app, Shopify CLI prompts you to update the app's configuration.
shopifyqlQuery requires the read_reports access scope and Level 2 access to protected customer data, which covers the name, address, phone, and email fields. Request both.
Anchor to Write the ShopifyQL queryWrite the Shopify
The dashboard shows this week's total sales, the change from last week, and the daily trend. ShopifyQL expresses all of that as a single query string.
Anchor to Run the query in a loaderRun the query in a loader
In the app's loader, authenticate the request, then call admin.graphql with a query that wraps your ShopifyQL string in the shopifyqlQuery field.
Request tableData for the results and parseErrors to detect an invalid query. Before reading the data, check the errors array so your app can handle a missing access scope or ungranted protected customer data access. The loader also runs a second query for the top-products leaderboard you'll build later.
Here's what each clause does:
FROMandSHOWread thesalesdataset fortotal_salesandorders.TIMESERIES dayreturns one row per day, which is what the trend chart plots.WITH TOTALSgives you this week's total sales as a single figure, and last week's total withCOMPARE TO previous_period.
Anchor to Read the results from the responseRead the results from the response
The response comes back as a tableData object with typed columns and rows, so your UI reads named values.
Anchor to Read the columns and rowsRead the columns and rows
Read columns and rows from tableData. Each column tells you its name, its dataType, and a human-readable displayName that you can use for headers and labels.
- Read columns by
name. Positional reads break as soon as you reorder theSHOWclause. - A cell can be null when a metric has no value for a row, so render a placeholder for null cells.
- Use
displayNamefor headers and legends, so the UI follows the query when the columns change.
Anchor to Format each value by its data typeFormat each value by its data type
Use each column's dataType to decide how to format its values. This query returns values in three data types.
DAY_TIMESTAMP: A day-granularity ISO 8601 date, like"2026-01-15". The timestamp granularity follows theTIMESERIESunit, so grouping bymonthreturns a month-granularity timestamp instead. Parse it and format for the user's locale, or use it directly as a chart axis.MONEY: A decimal string, like"2547.83". Keep it as a string to avoid floating-point rounding, and format it with the store's currency.INTEGER: A whole number returned as a string, like"42". Parse it to an integer if you need to calculate with it.
Anchor to Read the total and compute the changeRead the total and compute the change
WITH TOTALS puts this week's total in total_sales__totals and last week's in comparison_total_sales__previous_period__totals, repeated on every row. Read both from the first row by name, then compute the percent change yourself.
total_sales__totalsis this week's total. Keep it as a string for display, and parse it to a number only for the change calculation.comparison_total_sales__previous_period__totalsis last week's total, already summed for the whole period. Read it from the first row, the same way you read this week's total.- Compute the change as
(thisWeek - lastWeek) / abs(lastWeek) * 100. If last week is zero, then there's nothing to compare against, so skip the change.
Anchor to Show the headline metricShow the headline metric
The total and its change from last week are the headline, so they go at the top of the page. A metric card shows both, above the chart and table.
Anchor to Render the metric cardRender the metric card
Render the total in a Polaris web component section with total_sales__totals formatted as the store's currency, and show the computed percent change as an up or down badge against last week. If there's no earlier period to compare against, then show the total on its own.
The section, heading, and badge are Polaris web components, so they match the Shopify admin without any styling of your own.
Anchor to Show the trendShow the trend
The headline total is a single number. To show whether sales rose or fell across the week, plot the per-day series as a line chart under the metric.
Anchor to Render the trend chartRender the trend chart
Map the per-day rows to data points and render them with Polaris Viz, Shopify's React charting library. Use the DAY_TIMESTAMP column for the x-axis and total_sales for the line.
Install @shopify/polaris-viz:
Terminal
Wrap the chart in a PolarisVizProvider and import its stylesheet once. The chart is the only React component in the dashboard. The metric card, table, and app shell are Polaris web components, and the chart renders alongside them from the same route.
Anchor to Render the chart only on the clientRender the chart only on the client
Polaris Viz reads window when it draws, so it can't render during server-side rendering. Track when the component mounts on the client, and render the chart only after that. The rest of the page still renders on the server.
Anchor to Add a detail tableAdd a detail table
WITH TOTALS and COMPARE TO add the total_sales__totals and comparison_total_sales__previous_period__totals columns that the metric card reads, so filter out every __totals and comparison_ column and show only the per-day columns in the table. Map the remaining columns to headers using each column's displayName, and then map the rows to cells. Read each cell by column name so that the values line up with their headers.
Anchor to Rank the top productsRank the top products
The total and trend show how much the store sold. A second query shows what sold, ranking the store's best-selling products.
Anchor to Query and render the leaderboardQuery and render the leaderboard
The loader already runs this second query from Step 2. Define it and render the results as a ranked list or table below the trend.
GROUP BY TOP 10 product_titlekeeps the 10 products with the highestnet_salesand folds the rest into a singleOtherrow, so the list still sums to the store's total. AddONLYbeforeTOPto drop theOtherrow.ORDER BY net_sales DESCsorts the returned rows from highest to lowest.SINCE -30dranks over the last 30 days instead of the 7 the rest of the dashboard covers, because a single week is often too sparse for a stable ranking.
net_sales accounts for discounts and returns, and product_title comes back on each row, so you render product names without a second lookup.
Anchor to Handle empty, loading, and error statesHandle empty, loading, and error states
A dashboard runs against live stores, so it needs to hold up in states your working query won't trigger during the build. Handle a failed query, a store with no sales yet, and data that's still loading.
Anchor to Show a message for parse errorsShow a message for parse errors
When parseErrors contains a message, the query failed and returned no tableData. The dashboard runs two queries, so combine the parseErrors from both and render them in a banner instead of the dashboard.
Parse errors flag problems with the query text you wrote, such as an unknown field or a syntax mistake. Shopify returns them in the response rather than throwing GraphQL errors, so check parseErrors before you read tableData. During development, they're how you catch and fix a malformed query.
Anchor to Handle empty and loading statesHandle empty and loading states
If the store has no sales in the period, then show an empty state instead of a chart of flat zeros. Show a loading state for later navigations that re-run the loader, such as filters you might add.
Because TIMESERIES fills every day in the range, an empty period comes back as rows of zeros rather than zero rows, so check whether the period total is zero instead of the row count. React Router runs the loader before the first paint, so the first load never flashes empty. For the loading state, read the navigation state so a later navigation that re-runs the query shows a placeholder instead of stale data.
Anchor to Run the appRun the app
You've built every piece of the dashboard. Run the app on your development store to see it work end to end.
Anchor to Start the development serverStart the development server
From your app's directory, start the app with Shopify CLI, then open the preview URL it prints.
Terminal
On first run, Shopify CLI installs the app on your development store and completes the OAuth flow, so the loader's GraphQL Admin API request is authenticated. Open the app and confirm the dashboard shows this week's total sales, the change from last week, the daily trend, and the top products.
Anchor to Tutorial complete!Tutorial complete!
You built an embedded app that reports a store's weekly sales. It shows a metric card, a trend chart, and a top-products leaderboard, and handles empty, loading, and error states.
Anchor to Next stepsNext steps
Learn how to handle the errors and rate limits real stores hit, and explore the full ShopifyQL query language.

